 Aircraft Bluebook Marketline | Comments Off |
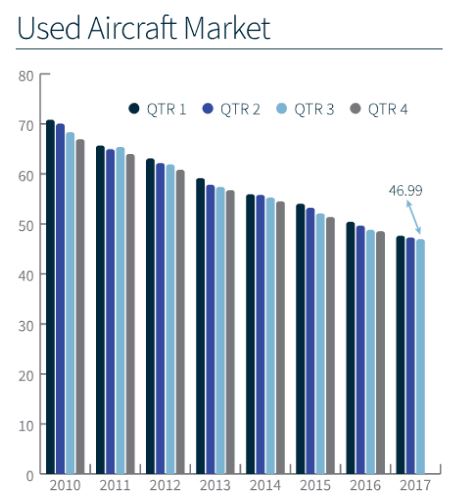
 Pre-Owned Business Aircraft Market Graphs from the Fall 2017 Marketline
 Thursday, October 5, 2017 at 12:00PM
All of the listed aircraft have a composite score that is presented in the Used Aircraft Market graph. Data points are represented in relationship to the respective new delivered historical price that is equal to 100%. The measure of change is reported in the actual percentage of value in relation to new. The delta between reporting periods can be concluded as the percentage of change ...
 Aircraft Bluebook Marketline | Comments Off |


