 Marketline Charts in
  Charts,
  Newsletter
  Monday, December 22, 2014 at 8:00AM
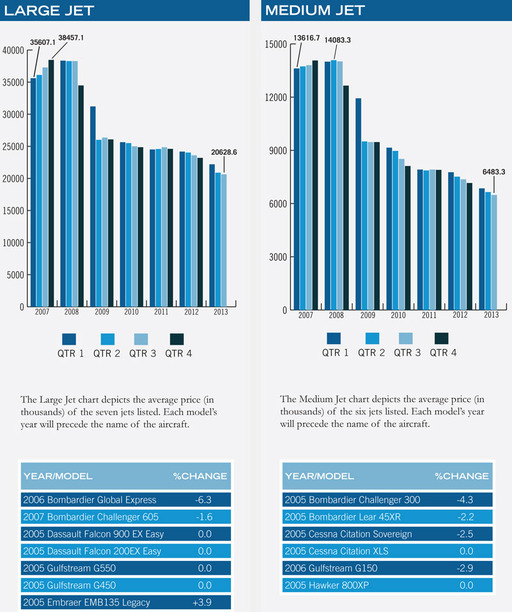
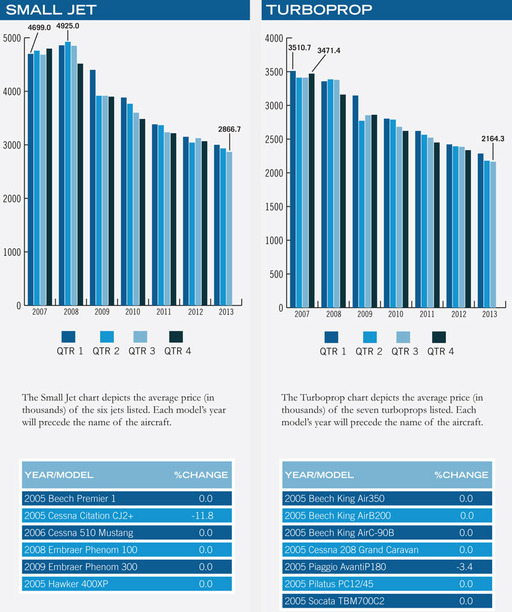
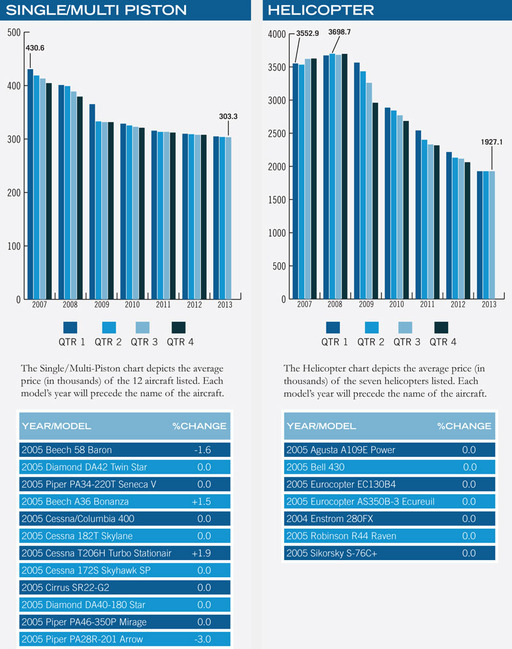
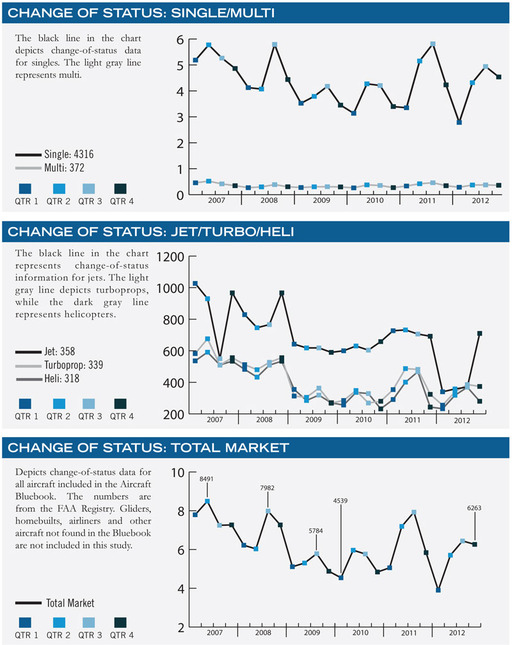
 Marketline's graphs show the trends for the broad used business aircraft market as well as the jet, turboprop, single/multi piston and helicopter categories.
 Marketline Charts in
  Charts,
  Newsletter
  Tuesday, December 17, 2013 at 9:15AM
  Click to View Full Size ChartCMS represents an aircraft’s current strength in the market. An A+ rating indicates the aircraft is enjoying a very firm market. Prices for an A+ aircraft are steadily rising, and holding times are very short or nonexistent. At the opposite end of the spectrum, a C- aircraft is one experiencing a very soft market. Its price is commonly discounted, and it often sets on the ramp in excess of eight months before selling. It is important to remember that Current Market Strength is not a forecast. It is valid only at Marketline’s effective date of release.
 Tuesday, September 10, 2013 at 2:02PM
  Click to View Full Size ChartCMS represents an aircraft’s current strength in the market. An A+ rating indicates the aircraft is enjoying a very firm market. Prices for an A+ aircraft are steadily rising, and holding times are very short or nonexistent. At the opposite end of the spectrum, a C- aircraft is one experiencing a very soft market. Its price is commonly discounted, and it often sets on the ramp in excess of eight months before selling. It is important to remember that Current Market Strength is not a forecast. It is valid only at Marketline’s effective date of release.
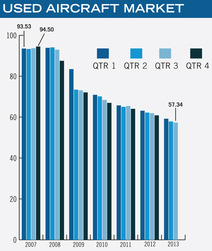 Click to View Full Size ChartAll of the listed aircraft have a composite score that is presented in the Used Aircraft Market graph. Data points are represented in relationship to the respective new delivered historical price that is equal to 100%. The measure of change is reported in the actual percentage of value in relation to new. The delta between reporting periods can be concluded as the percentage of change.
Click here to download a PDF of the full Marketline Newsletter, including articles and all Charts.
 Click to View Full Size Chart
  Click to View Full Size Chart
 Click to View Full Size Chart
 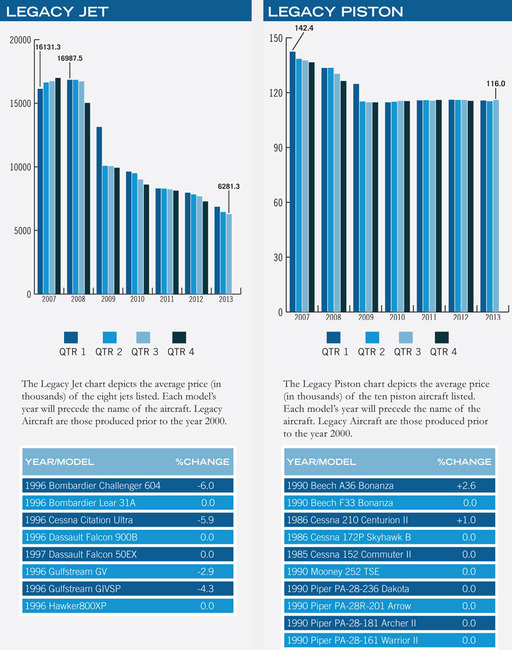 Click to View Full Size Chart
 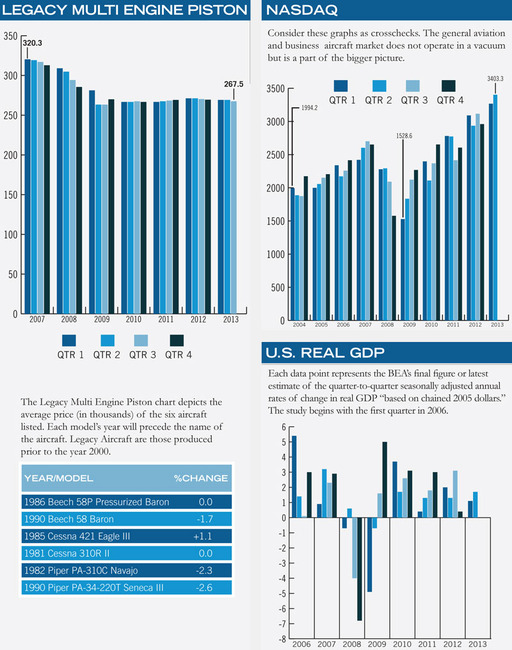 Click to View Full Size Chart
 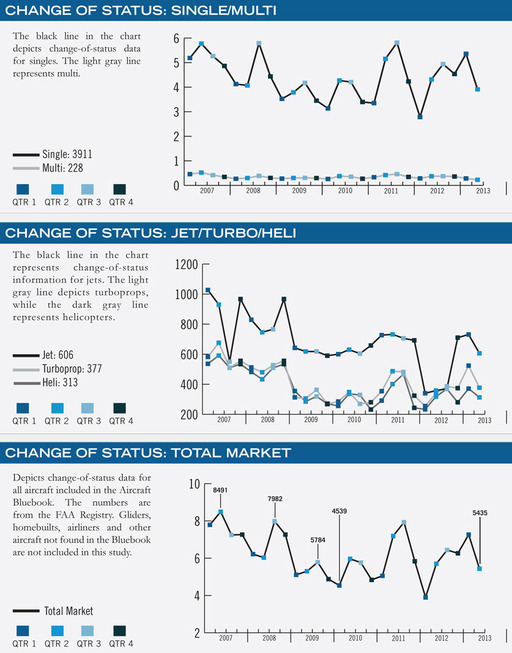 Click to View Full Size Chart
 Monday, June 10, 2013 at 8:28AM
  Click to View Full Size ChartCMS represents an aircraft’s current strength in the market. An A+ rating indicates the aircraft is enjoying a very firm market. Prices for an A+ aircraft are steadily rising, and holding times are very short or nonexistent. At the opposite end of the spectrum, a C- aircraft is one experiencing a very soft market. Its price is commonly discounted, and it often sets on the ramp in excess of eight months before selling. It is important to remember that Current Market Strength is not a forecast. It is valid only at Marketline’s effective date of release.
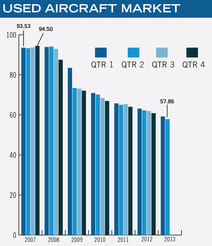 Click to View Full Size ChartAll of the listed aircraft have a composite score that is presented in the Used Aircraft Market graph. Data points are represented in relationship to the respective new delivered historical price that is equal to 100%. The measure of change is reported in the actual percentage of value in relation to new. The delta between reporting periods can be concluded as the percentage of change.
Click here to download a PDF of the full Marketline Newsletter, including articles and all Charts.
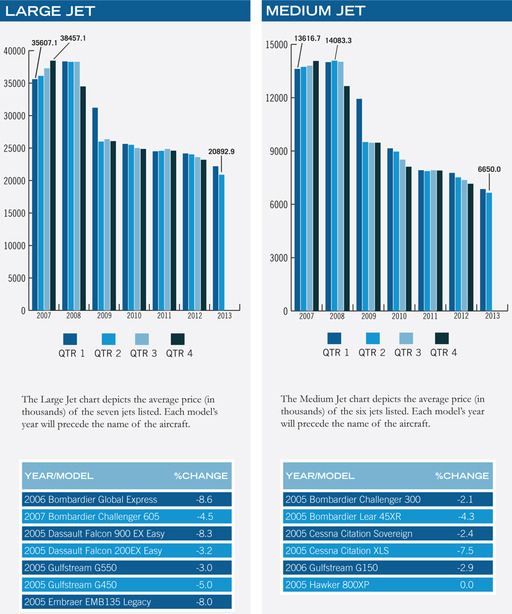 Click to View Full Size Chart
 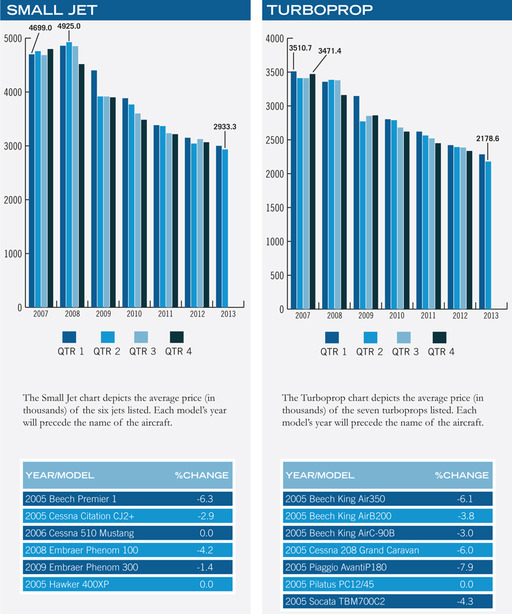 Click to View Full Size Chart
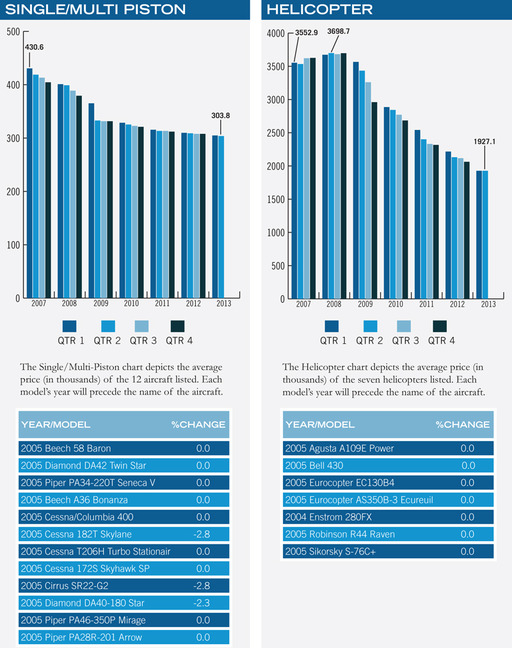 Click to View Full Size Chart
 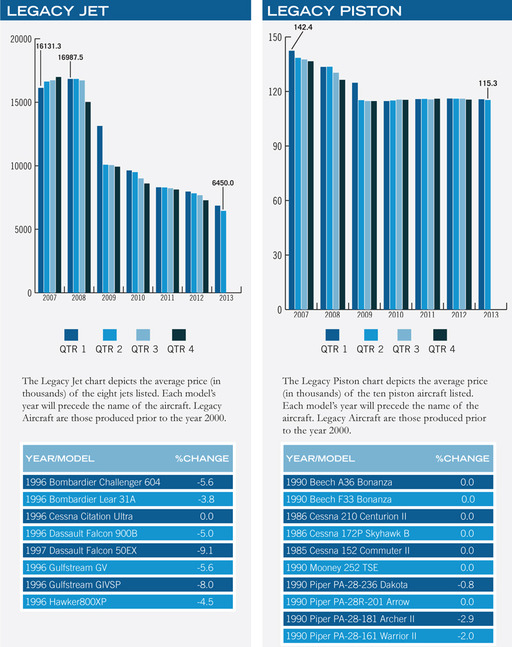 Click to View Full Size Chart
 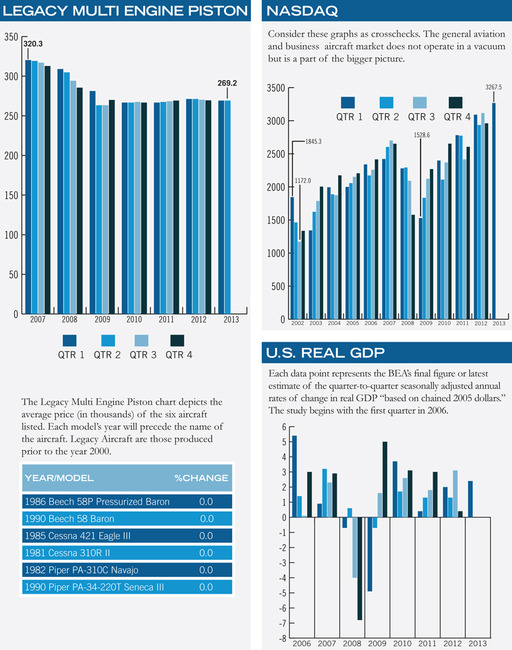 Click to View Full Size Chart
 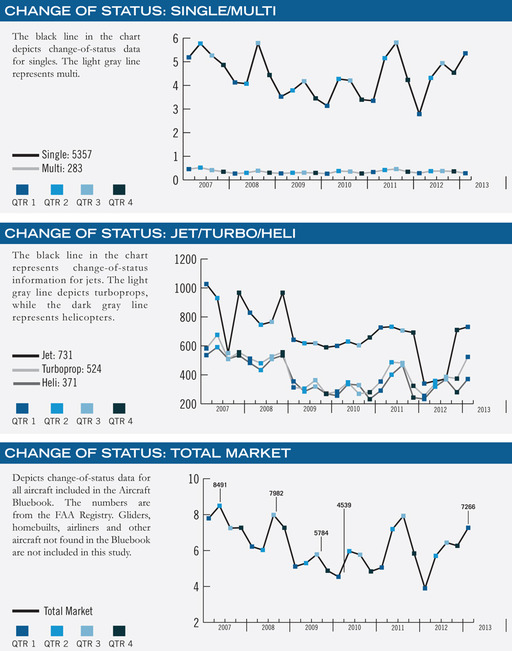 Click to View Full Size Chart
 Monday, March 11, 2013 at 10:18AM
  Click to View Full Size ChartCMS represents an aircraft’s current strength in the market. An A+ rating indicates the aircraft is enjoying a very firm market. Prices for an A+ aircraft are steadily rising, and holding times are very short or nonexistent. At the opposite end of the spectrum, a C- aircraft is one experiencing a very soft market. Its price is commonly discounted, and it often sets on the ramp in excess of eight months before selling. It is important to remember that Current Market Strength is not a forecast. It is valid only at Marketline’s effective date of release.
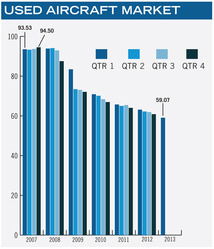 Click to View Full Size ChartAll of the listed aircraft have a composite score that is presented in the Used Aircraft Market graph. Data points are represented in relationship to the respective new delivered historical price that is equal to 100%. The measure of change is reported in the actual percentage of value in relation to new. The delta between reporting periods can be concluded as the percentage of change.
Click here to download a PDF of the full Marketline Newsletter, including articles and all Charts.
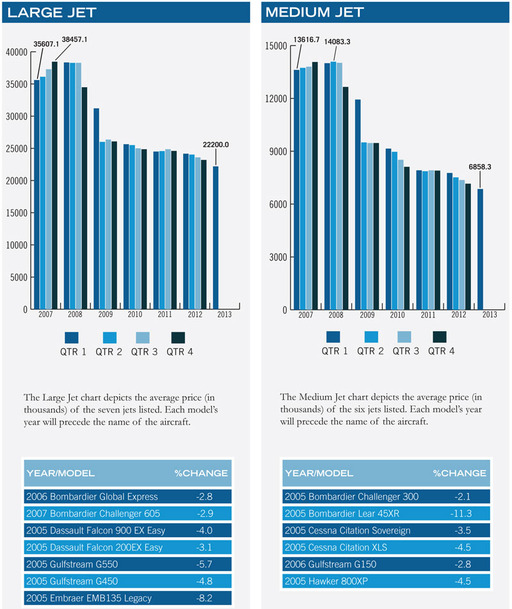 Click to View Full Size Chart
 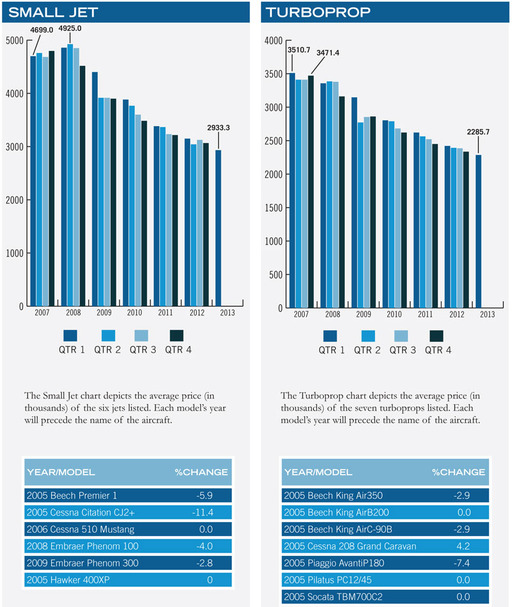 Click to View Full Size Chart
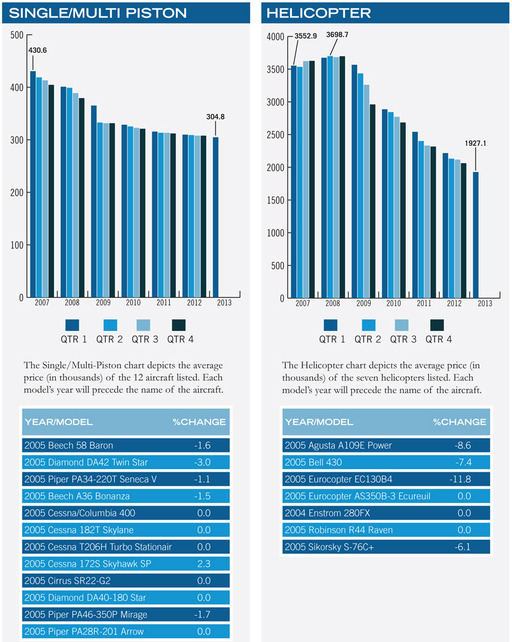 Click to View Full Size Chart
 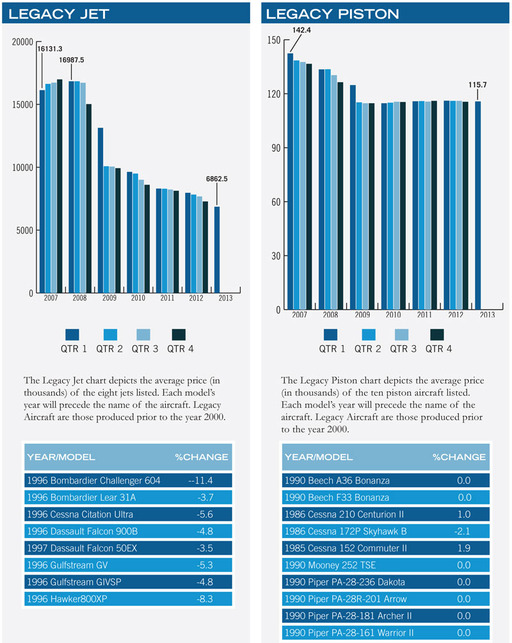 Click to View Full Size Chart
 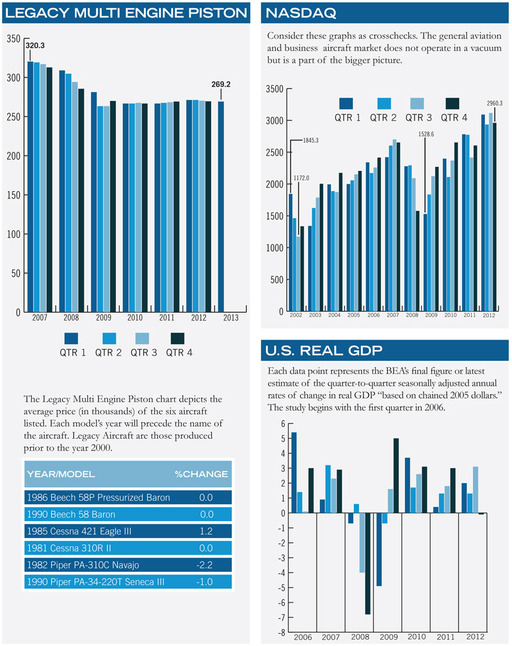 Click to View Full Size Chart
  Click to View Full Size Chart