tagged  FAA Registry, business aircraft, helicopter, jet, multi, piston, pre-owned aircraft, single, turboprop, used aircraft, values in Charts
Charts 


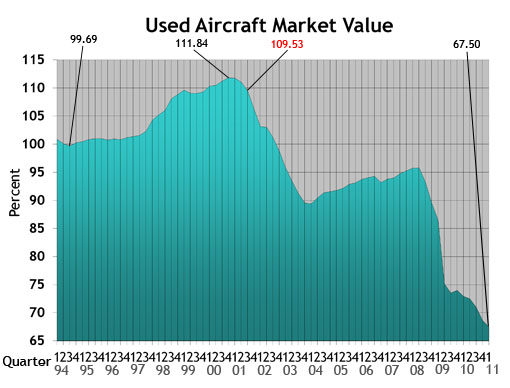
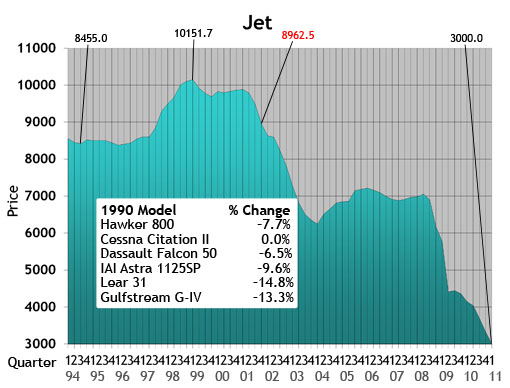
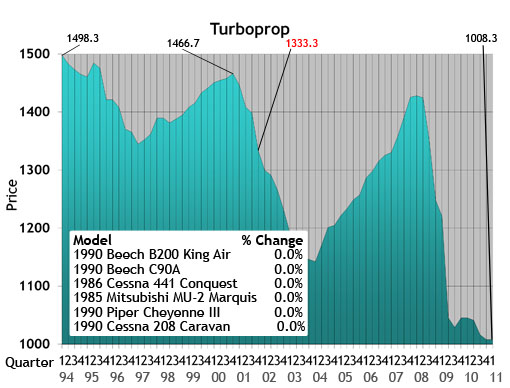
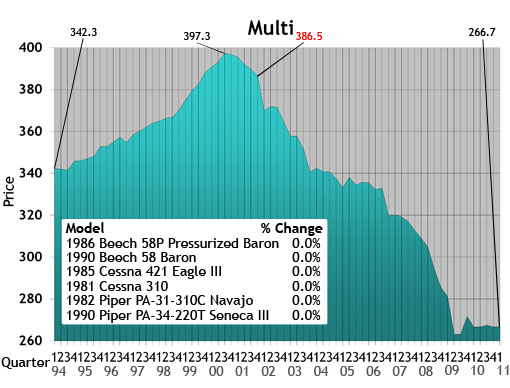
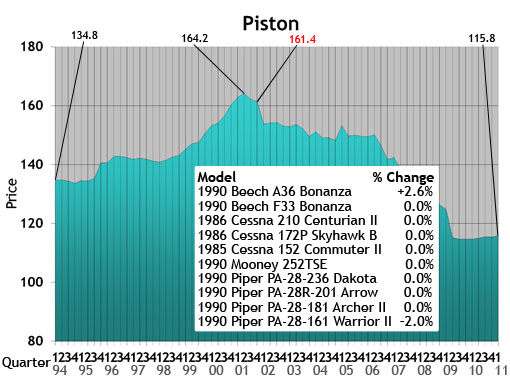
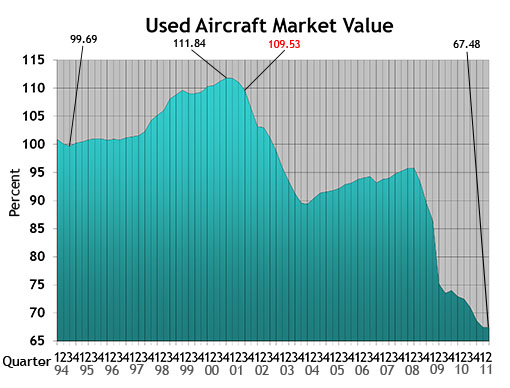 Used Aircraft Market: This chart displays each model's quarterly value in relationship to its average equipped price at the inception of the aircraft. The study begins in the spring quarter of 1994 and includes the Jet, Turboprop, Multi, Piston and Helicopter. For all charts, the red number indicates the first reporting date after 9-11.
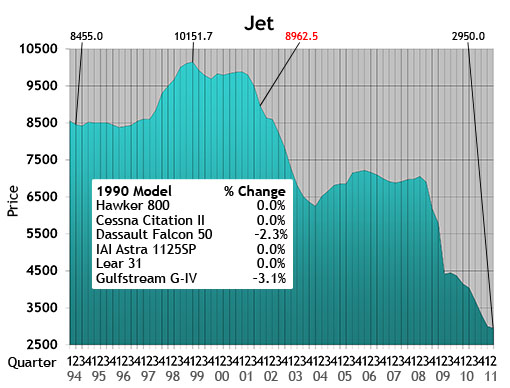 Jet: The jet chart depicts the average price (in thousands) of the six 1990s jets listed in the box.
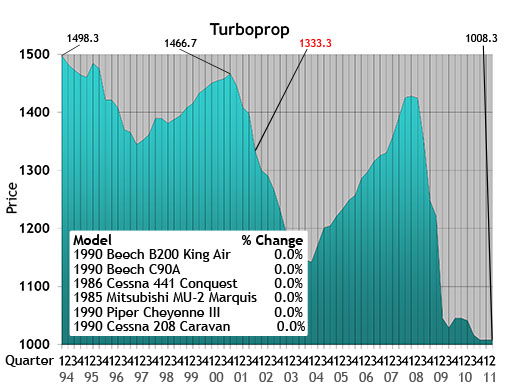 Turboprop: The turboprop chart depicts the average price (in thousands) of a 1985, 1986 and four 1990 turboprops listed in the box.
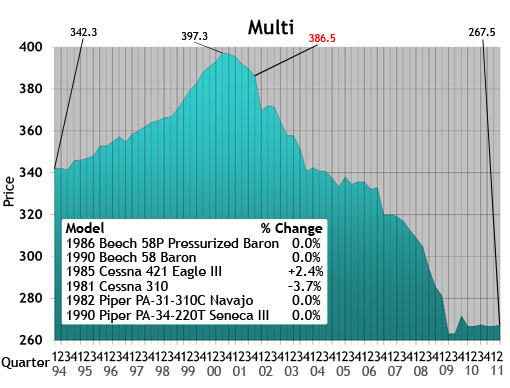 Multi: The multi chart depicts the average price (in thousands) of the six multi models listed in the box. Each model’s year will precede the name of the aircraft.
 Piston: The piston chart depicts the average price (in thousands) of the 10 pistons listed in the box. Each model’s year will precede the name of the aircraft.
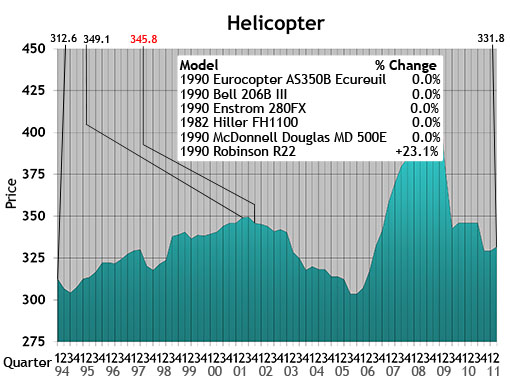 Helicopter: The helicopter chart depicts the average price (in thousands) of the six helicopters listed in the box. Each model’s year will precede the name of the aircraft.
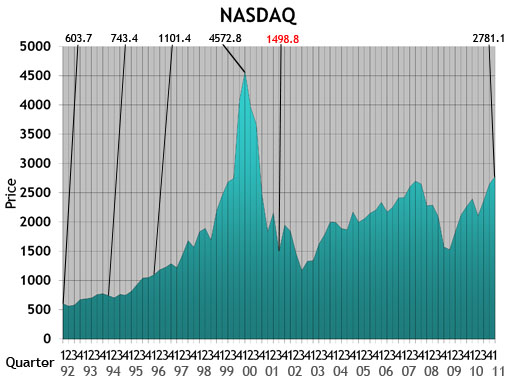 NASDAQ: This ratio scale chart depicts the change for the NASDAQ daily average from quarter to quarter beginning at the end of the first quarter of 1992. Each data point represents the closing daily average on the last trading day of each quarter. This study originates in the first quarter of 1971.
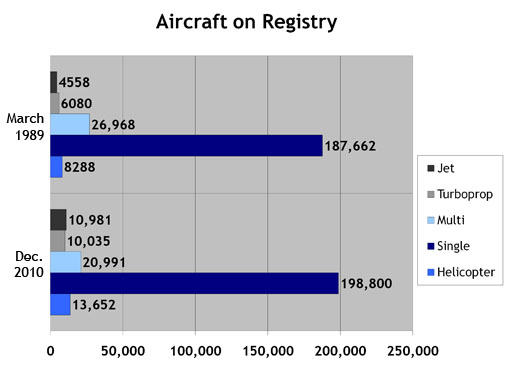
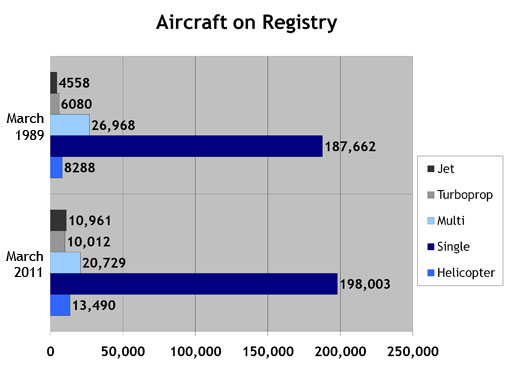 Aircraft on Registry: The Aircraft on Registry chart depicts the number of aircraft reported in Aircraft Bluebook that are listed on FAA records and considered to be in the U.S. inventory.
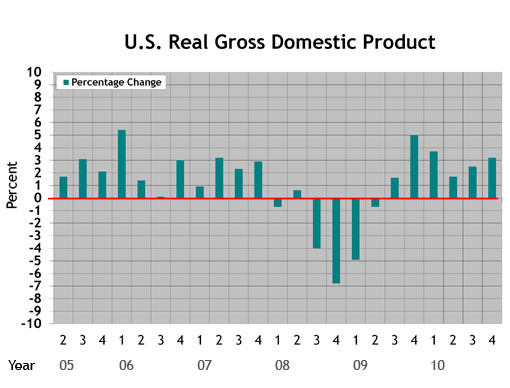
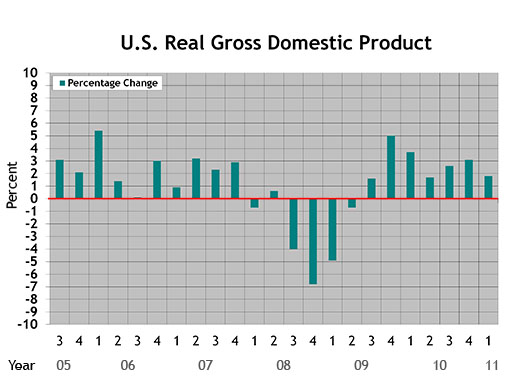 U.S. Real Gross Domestic Product (criteria updated Aug. 27, 2010): This graph represents real gross domestic product measured by the U.S. Bureau of Economic Analysis. Each data point represents the BEA's final figure or latest estimate of the quarter-to-quarter seasonally adjusted annual rates of change in real GDP "based on chained 2005 dollars." The study begins with the second quarter in 2005.
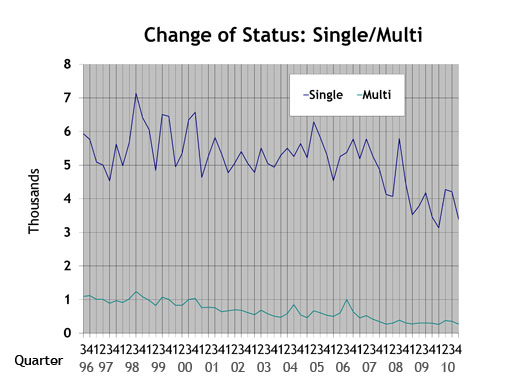
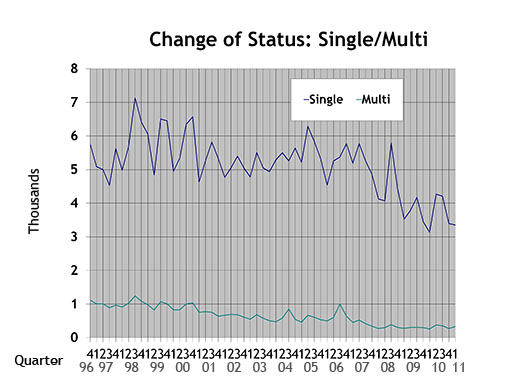 Single/Multi: The blue line in the Single/Multi chart depicts change-of-ownership data for singles. The black line represents multis.
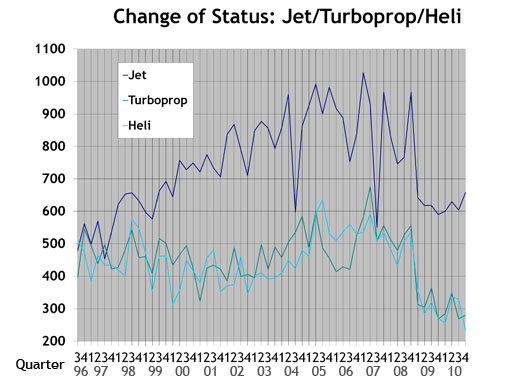
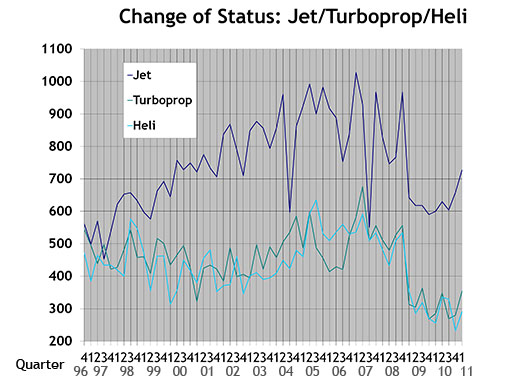 Jet/Turboprop/Heli: The black line in the Jet/Turboprop/Heli chart represents change-of-ownership information for jets. The blue line depicts turboprops, and the gray line represents helicopters.
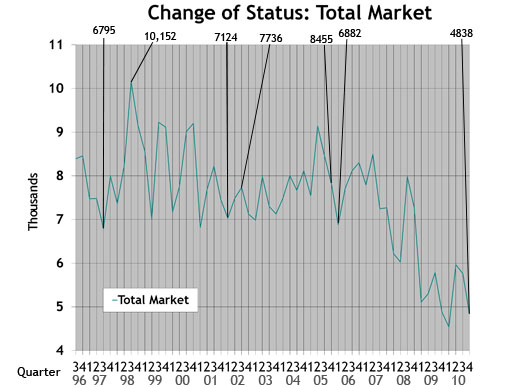
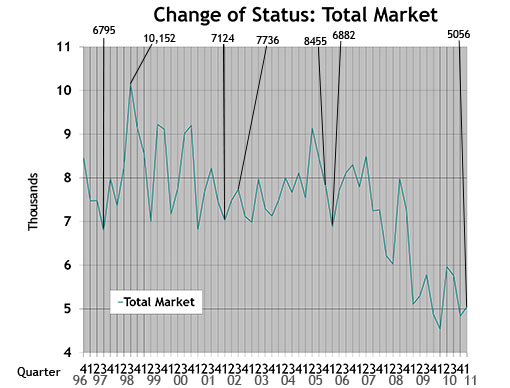 Total Market: Depicts change-of-ownership data for all aircraft included in the Aircraft Bluebook. The numbers are from the FAA Registry. Gliders, homebuilts, airliners and other aircraft not found in the Bluebook are not included in this study.
Vol. 24, No. 1 | March 8, 2011 | Go to Charts
by Carl Janssens, ASA | Aircraft Bluebook — Price Digest
Have you ever been involved in an incident when you actually made the news?
I have. No, nothing in my life as the editor of Aircraft Bluebook–Price Digest has been particularly newsworthy. But in my previous life as a 25-year veteran in law enforcement with the Kansas City, Mo., Police Department, I sure can relate.
In some cases, my experiences during a particular incident and what I later read in the news about the same incident did not match. Not to knock any journalists for their reporting skills, I am making the point that it is hard to report third-hand information.
Instead of reviewing market statistics to summarize business aircraft activity, I’m going to shoot from the hip, so to speak, and generalize my personal experiences with those I have been in direct contact with who were directly involved with an aircraft transaction.
Business has improved. The only downside to making the deal happen is that the values of yesterday in some aircraft markets are not making a comeback. Breaking it down, late-model, long-range large-cabins are competitive. I can say this because reported values are not skidding downhill. They are holding steady if not improving. Time and condition do impact value.
Looking at the mid-cabin class, sales are also rebounding, but pricing, not so much. Yesterday’s sale price is stronger than today’s. It is what it is.
Light jets and VLJs tell the same story as the mid-cabin class. Turboprops, the muscle of short hops, heavy loads and limited runway environments, are showing a good steady trend of transactions. On the topic of values, what these turboprops are worth today will be a little less tomorrow. If I had to give it a name, I would call it standard depreciation. That alibi will just about work anywhere.
Purchasing piston-powered aircraft is like buying a car. Who in their right mind would buy a new car as an investment? Reported transactions seem to follow my rationalization. I could not find one person who bought a piston-powered aircraft for an investment but plenty who bought for business use and even a few — very few — who bought for personal recreation. No discoveries were noted with values improving, but again, there were plenty of sales.
I have been with the Bluebook for a dozen years now. Reporting on values would be difficult if not for the good support I get from all of you in the trenches making transactions happen. My sincere thanks and gratitude.
Bluebook-at-a-glance
Increased — 3
Decreased — 534
Stable — 378
Early model Citation Xs were down this quarter. The Citation Mustang gained $100,000 when compared to the winter quarter. The late-model, long-range, large-cabin-class business jets remained stable for yet another quarter. Mid-range cabin business jets were off slightly again this quarter. Check your Bluebook for specifics.
Bluebook-at-a-glance
Increased — 0
Decreased — 70
Stable — 530
The turboprop market displayed little movement in values when compared to the previous quarter. Prices, still softer than previous reporting periods, were not eclipsed by the sales volume of aircraft.
Bluebook-at-a-glance
Increased — 12
Decreased — 38
Stable — 605
In the multi-engine category, sales reports were better than what Bluebook received for the previous quarter. Quantity was higher while values remained fairly stable.
Bluebook-at-a-glance
Increased — 133
Decreased — 280
Stable — 2095
There was a slight increase in values of the Beechcraft Bonanza 36 series. Reported retail values were slightly higher than the winter Bluebook values. Take a look in the Bluebook to see if your aircraft got the positive bump in value this quarter. Ag piston aircraft values increased this reporting period as well.
Bluebook-at-a-glance
Increased — 33
Decreased — 79
Stable — 942
This market is all about time and condition. Overall, rotary market sales have been nearly the same in the value range when compared to recent Bluebook retail values.
Please contact Aircraft Bluebook if you have any specific concern in a particular aircraft market. We will be happy to share with you the most up-to-date information available for your market segment. Call us toll-free at 877-531-1450 or direct at 913-967-1913.
 Used Aircraft Market: This chart displays each model's quarterly value in relationship to its average equipped price at the inception of the aircraft. The study begins in the spring quarter of 1994 and includes the Jet, Turboprop, Multi, Piston and Helicopter. For all charts, the red number indicates the first reporting date after 9-11.
 Jet: The jet chart depicts the average price (in thousands) of the six 1990s jets listed in the box.
 Turboprop: The turboprop chart depicts the average price (in thousands) of a 1985, 1986 and four 1990 turboprops listed in the box.
 Multi: The multi chart depicts the average price (in thousands) of the six multi models listed in the box. Each model’s year will precede the name of the aircraft.
 Piston: The piston chart depicts the average price (in thousands) of the 10 pistons listed in the box. Each model’s year will precede the name of the aircraft.
 Helicopter: The helicopter chart depicts the average price (in thousands) of the six helicopters listed in the box. Each model’s year will precede the name of the aircraft.
 NASDAQ: This ratio scale chart depicts the change for the NASDAQ daily average from quarter to quarter beginning at the end of the first quarter of 1992. Each data point represents the closing daily average on the last trading day of each quarter. This study originates in the first quarter of 1971.
 Aircraft on Registry: The Aircraft on Registry chart depicts the number of aircraft reported in Aircraft Bluebook that are listed on FAA records and considered to be in the U.S. inventory.
 U.S. Real Gross Domestic Product (criteria updated Aug. 27, 2010): This graph represents real gross domestic product measured by the U.S. Bureau of Economic Analysis. Each data point represents the BEA's final figure or latest estimate of the quarter-to-quarter seasonally adjusted annual rates of change in real GDP "based on chained 2005 dollars." The study begins with the second quarter in 2005.
 Single/Multi: The blue line in the Single/Multi chart depicts change-of-ownership data for singles. The black line represents multis.
 Jet/Turboprop/Heli: The black line in the Jet/Turboprop/Heli chart represents change-of-ownership information for jets. The blue line depicts turboprops, and the gray line represents helicopters.
 Total Market: Depicts change-of-ownership data for all aircraft included in the Aircraft Bluebook. The numbers are from the FAA Registry. Gliders, homebuilts, airliners and other aircraft not found in the Bluebook are not included in this study.
Charts 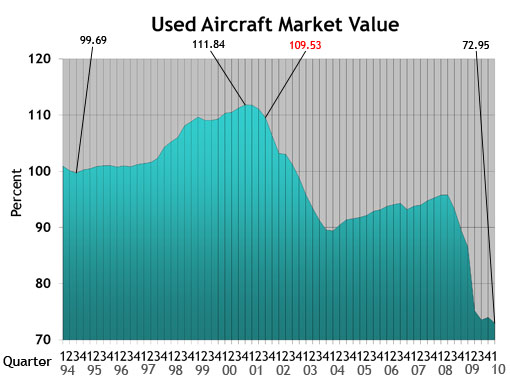 Used Aircraft Market: This chart displays each model's quarterly value in relationship to its average equipped price at the inception of the aircraft. The study begins in the spring quarter of 1994 and includes the Jet, Turboprop, Multi, Piston and Helicopter. For all charts, the red number indicates the first reporting date after 9-11.
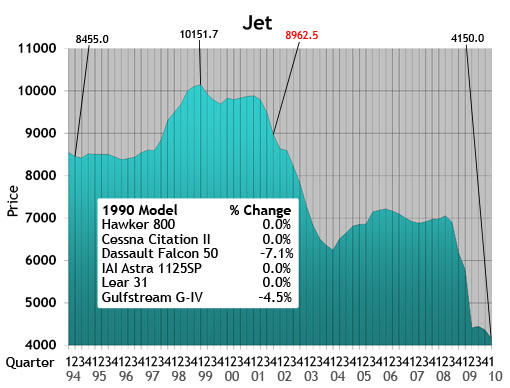 Jet: The jet chart depicts the average price (in thousands) of the six 1990s jets listed in the box.
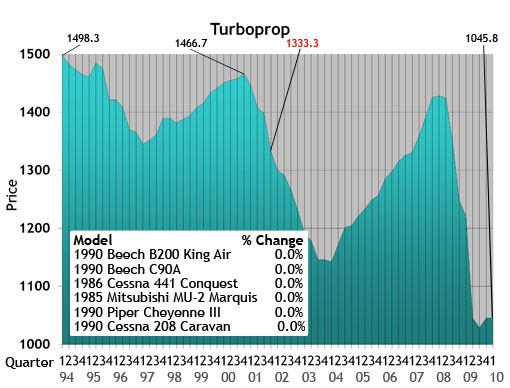 Turboprop: The turboprop chart depicts the average price (in thousands) of a 1985, 1986 and four 1990 turboprops listed in the box.
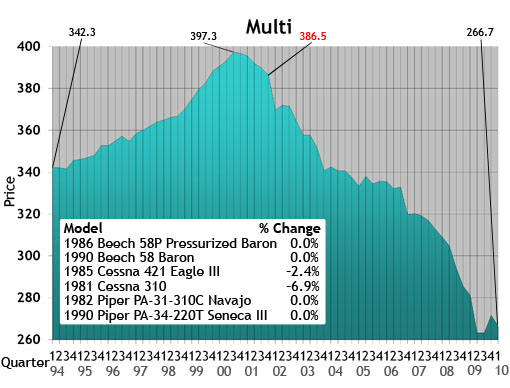 Multi: The multi chart depicts the average price (in thousands) of the six multi models listed in the box. Each model’s year will precede the name of the aircraft.
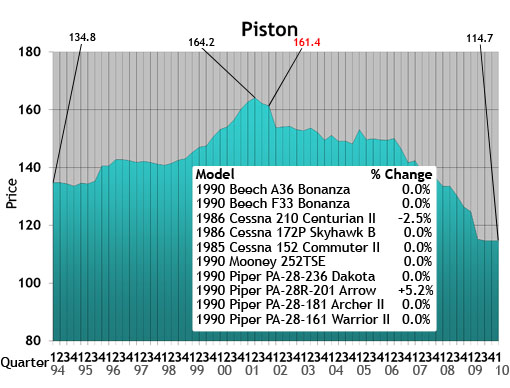 Piston: The piston chart depicts the average price (in thousands) of the 10 pistons listed in the box. Each model’s year will precede the name of the aircraft.
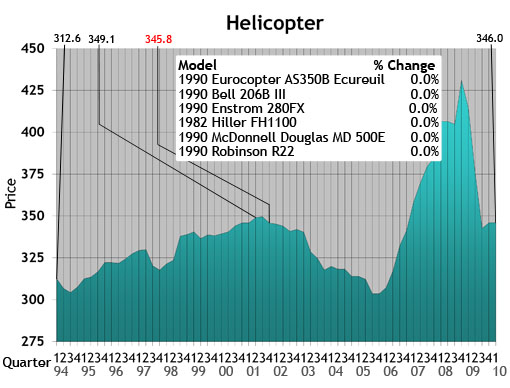 Helicopter: The helicopter chart depicts the average price (in thousands) of the six helicopters listed in the box. Each model’s year will precede the name of the aircraft.
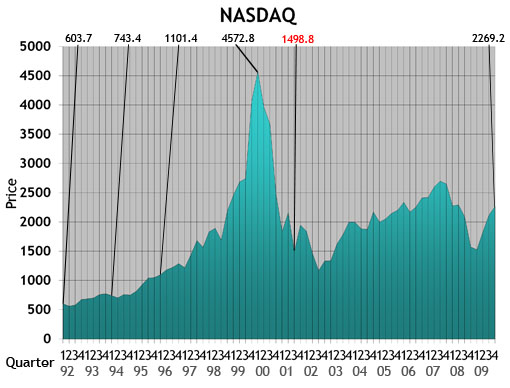 NASDAQ: This ratio scale chart depicts the change for the NASDAQ daily average from quarter to quarter beginning at the end of the first quarter of 1992. Each data point represents the closing daily average on the last trading day of each quarter. This study originates in the first quarter of 1971.
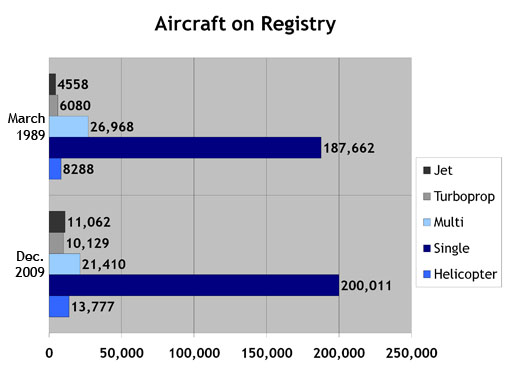 Aircraft on Registry: The Aircraft on Registry chart depicts the number of aircraft reported in Aircraft Bluebook that are listed on FAA records and considered to be in the U.S. inventory.
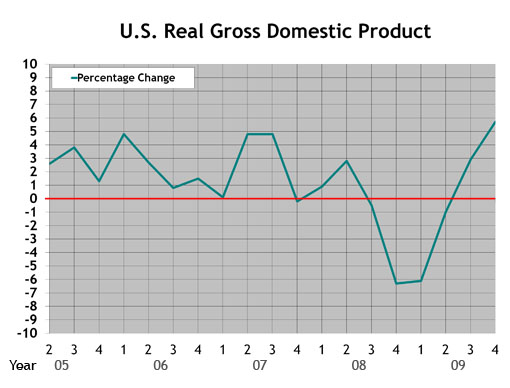 U.S. Real Gross Domestic Product: This graph represents real gross domestic product measured by the U.S. Department of Commerce. Each data point represents the percentage change from the 2005 baseline GDP. The study begins with the second quarter in 2005.
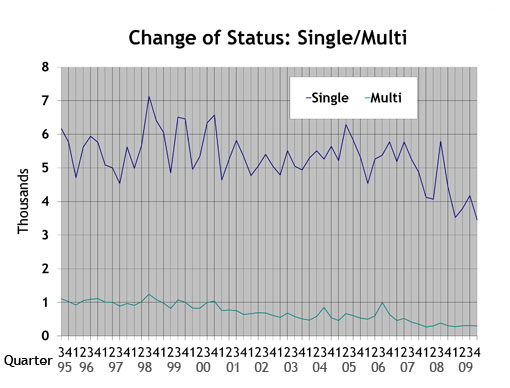 Single/Multi: The blue line in the Single/Multi chart depicts change-of-ownership data for singles. The black line represents multis.
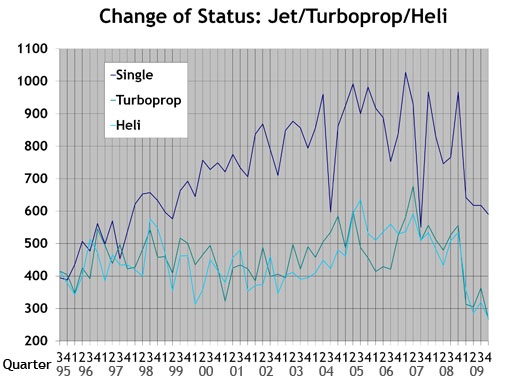 Jet/Turboprop/Heli: The black line in the Jet/Turboprop/Heli chart represents change-of-ownership information for jets. The blue line depicts turboprops, and the gray line represents helicopters.
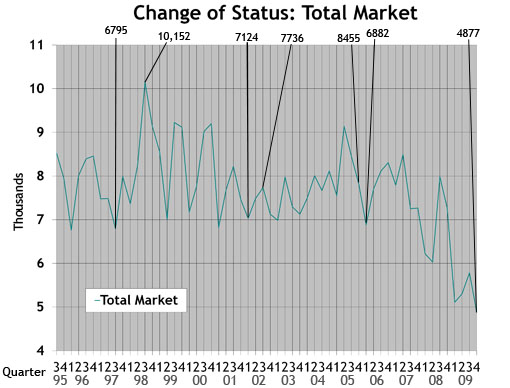 Total Market: Depicts change-of-ownership data for all aircraft included in the Aircraft Bluebook. The numbers are from the FAA Registry. Gliders, homebuilts, airliners and other aircraft not found in the Bluebook are not included in this study.
Charts by Carl Janssens, ASA | Aircraft Bluebook — Price Digest
Aircraft values reported in the previous quarter were in a spiral dive, but the economy’s pilot now appears to have neutralized the rapid descent.
For the most part, values have arrived at ground level. Inventories have shown signs of stability with little or no growth in units for sale. Other market indicators show signs of neutralization as well. Aircraft dealers and brokers report that interest has increased. Phones are ringing more with potential buyers on the line. Compared to the 2005 baseline real gross domestic product, GDP declined 1.0 percent in the second quarter of 2009 after declining 6.4 percent in the first quarter. These indicators support the signs of neutralization in the marketplace, though the used aircraft market has no reason to rally.
Maybe the market has not yet reached the dawn of a recovery, but the market has absorbed the fallen values. The jet segment is the most volatile portion of the aircraft market. Flight departments that were liquidated are no longer creating a frenzy of drastic value reductions. Manufacturers finding new homes for new aircraft in default maintain nearly full sales values. The only difference is that deposits from contracts in default allow discounts to the new buyers. Once these sales are complete, the discounts will end.
Bluebook-at-a-glance
Increased — 143
Decreased — 49
Stable — 665
Bluebook’s attention has focused on late-model large-cabin new deliveries that may take as long as two years or more for interior completion and delivery. Some of the increase in value can be found in the fall edition of Aircraft Bluebook. Examples include the Bombardier Global family as well as the Challenger 605 and Dassault Falcon 900 and 2000 series.
Bluebook-at-a-glance
Increased — 75
Decreased — 114
Stable — 399
Socata fared better in this reporting period. Sales demonstrated that values were better than previously reported; therefore, stronger values appear in the new release of Bluebook. Turboprop ag planes continue to demonstrate improved values with limited inventories available in the world market. The Piaggio was up 9 percent from the previous quarter as well.
Bluebook-at-a-glance
Increased — 0
Decreased — 110
Stable — 545
For the most part, values remained unchanged for this reporting period in the multipiston category. Nothing increased in value. Most late models held on to their values without loss. Early model Cessnas as well as some Twin Commanders trended downward slightly.
Bluebook-at-a-glance
Increased — 117
Decreased — 220
Stable — 2108
Ag planes kept a positive note in the single category. Select models experienced modest increases. Some of the decreases included American Champions, such as the 8-KCAB, and Beech 35. Both were reported down from the previous quarter. For the most part, however, most single-engine pistons remained steady for this reporting period.
Bluebook-at-a-glance
Increased — 4
Decreased — 828
Stable — 177
Helicopter values experienced a decline in this quarter. Part of the decline may relate to lower values on earlier models with limited mission capabilities when compared to newer helicopters. Early-model Sikorsky aircraft as well as Bell and Eurocopter models were down. Decreases averaged 8 percent or more. In the piston category, values were lower, too.
Please contact Aircraft Bluebook if you have any specific concern in a particular aircraft market. We will be happy to share with you the most up-to-date information available for your market segment. Call us toll free at 877-531-1450 or direct at 913-967-1913.